Google shipped the report everyone has been asking for since AI Overviews launched. Then it left out the number that would have made it useful.
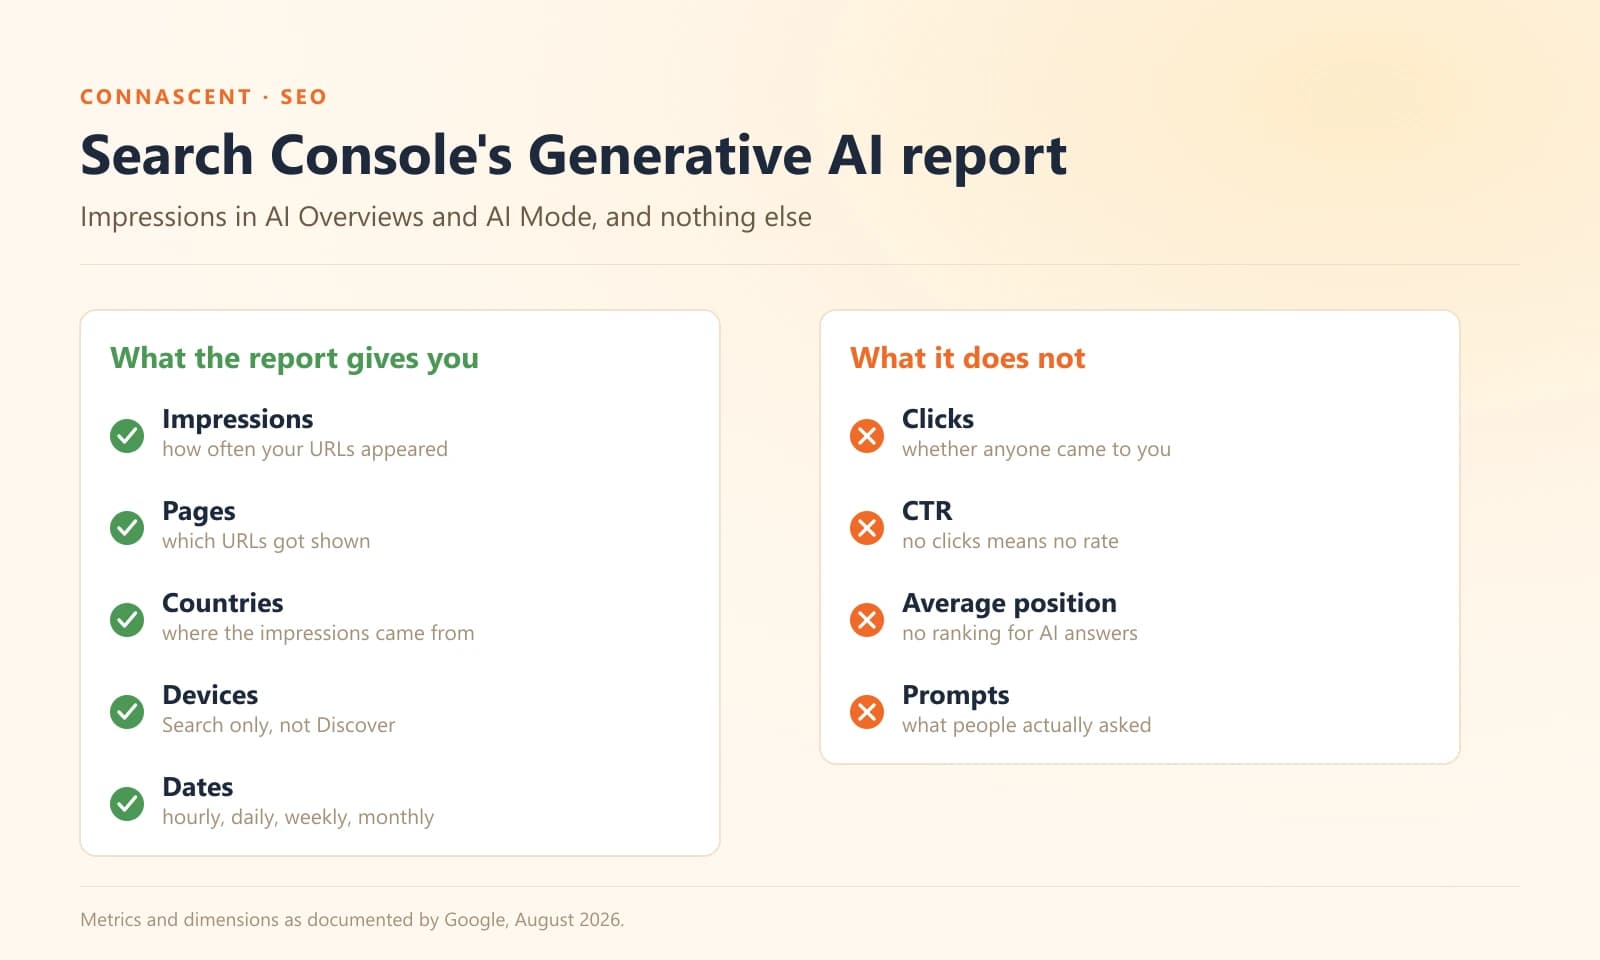
The Generative AI performance report gives you impressions in AI Overviews and AI Mode, broken out from the rest of your Search data for the first time. It does not give you clicks. It does not give you click-through rate, average position, or the prompts people typed to get there.
That is not a small gap, and I am not going to pretend it is. But the report is still worth ten minutes of your month, for one specific reason that has nothing to do with measuring performance.
The short version
- The report shows impressions only, sliced by page, country, device and date. No clicks, no CTR, no position, no prompts.
- It covers AI Overviews and AI Mode on Search, plus a separate report for Discover. Search Labs experiments are excluded.
- Your AI impressions were already inside your total Search impressions. This is a filter, not extra visibility. Do not add them together.
- Every chart starts on 18 May 2026, so nobody has year-over-year data until May 2027.
- Use it to find which pages Google's AI already cites. Do not use it as a KPI, and do not put it in a client report as a win.
What Google actually shipped
A separate view, not a new number
On 3 June 2026, Hillel Maoz and Moshe Samet of the Search Console team announced dedicated generative AI performance reports for both Search and Discover.
The wording in that announcement matters more than most people noticed. The data, Google says, "is included in the overall performance report, where it will continue to be tracked." What launched is "a separate view dedicated to visibility from generative AI features."
So nothing new is being counted. These impressions were always in your totals; you just could not see them on their own. Hold on to that, because it is where the reporting mistakes are going to come from.
Which surfaces it covers
AI Overviews and AI Mode on Google Search, and generative AI features in Discover. Google's documentation excludes Search Labs experiments outright, on the grounds that they are "still in active development."
The data is drawn from the Web search type in the standard Performance report. Image, video and news search types are not in scope.
What you get, and what you don't
The five things it shows you
Impressions, meaning how often URLs from your site appeared in a generative AI feature. Pages, so you can see which URLs those were. Countries. Devices, for Search results only. And dates, at hourly, daily, weekly or monthly granularity.
Hourly granularity on a report with no clicks is an odd flex, but it is there.
The four things it withholds
Clicks. Click-through rate. Average position. And the prompts.
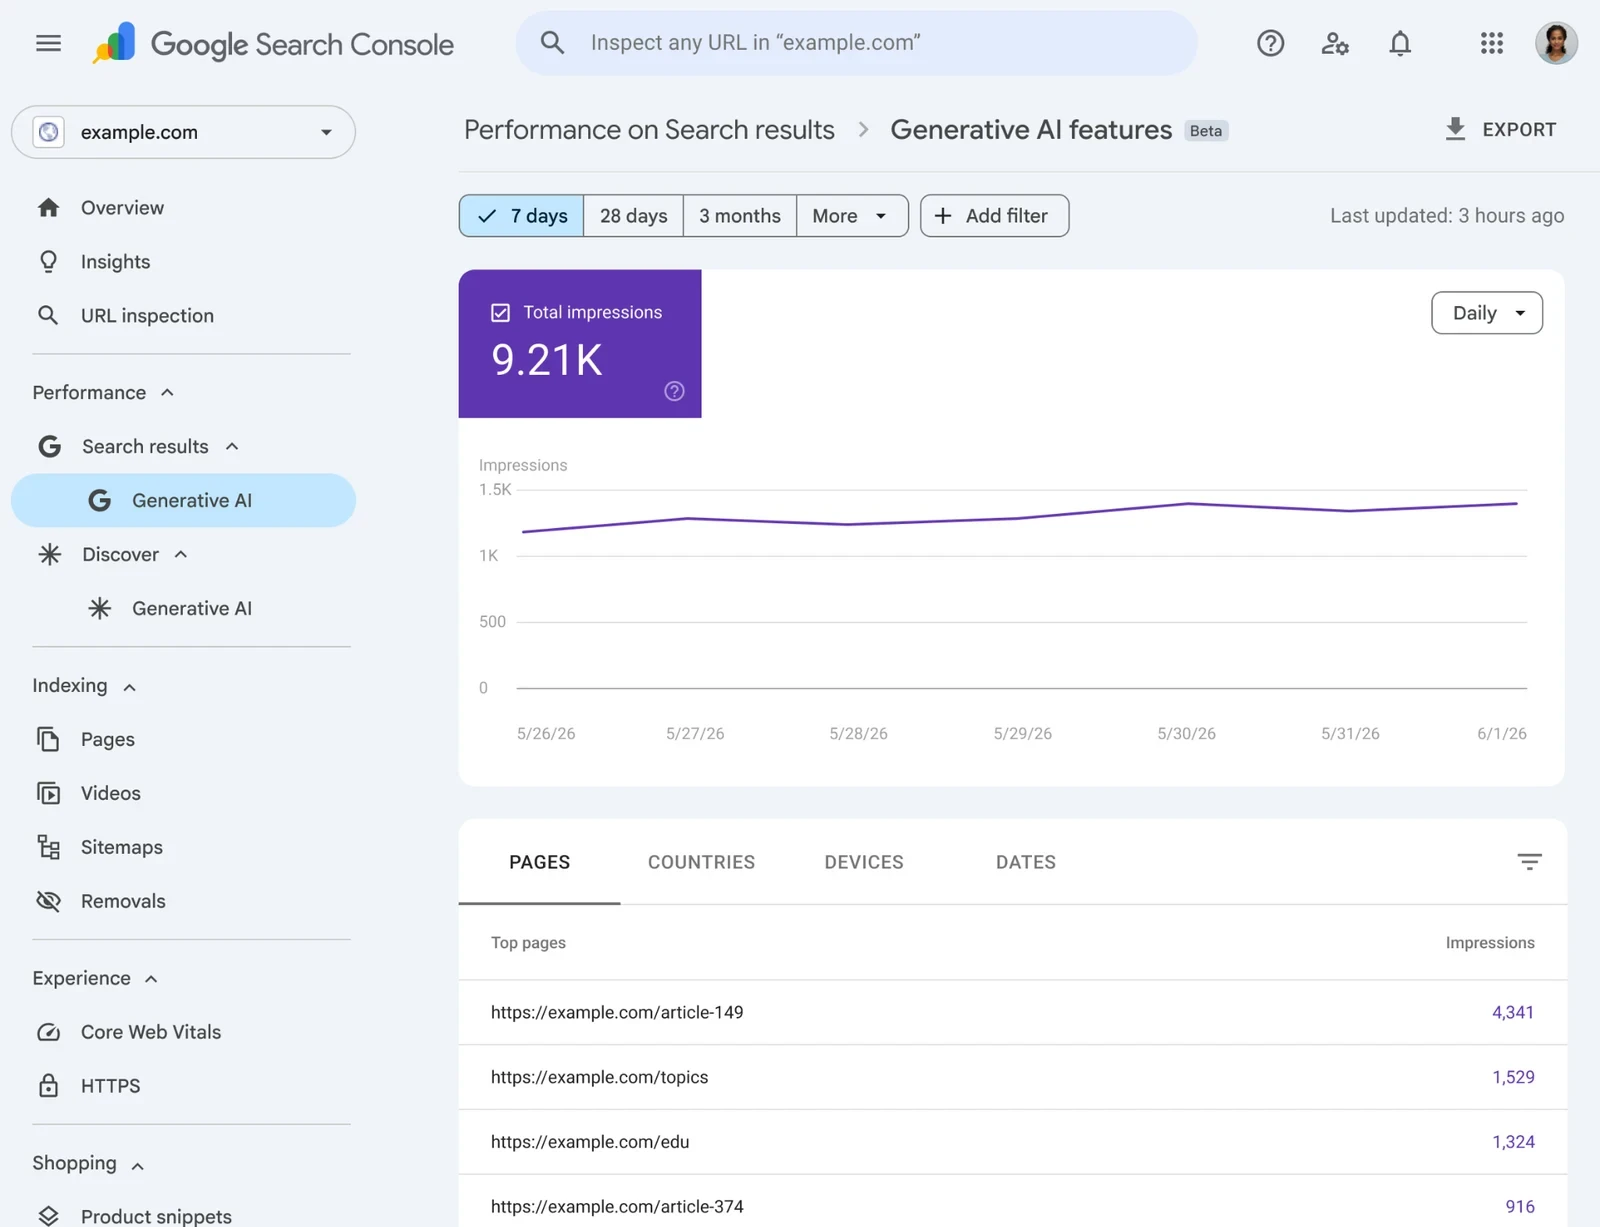
Look at Google's own screenshot above. There is one metric tile. In the standard Performance report you get four toggles across the top: clicks, impressions, CTR and average position. Here there is a single purple square with an impression count in it.
The missing prompts hurt more than the missing clicks
Most of the commentary has focused on the absent click data, and that is the gap that stops you proving value. But the missing query dimension is the one that stops you doing anything at all.
Without clicks, you cannot tell your client whether AI visibility earned them money. Annoying, but you can triangulate that from analytics and revenue.
Without prompts, you cannot tell which questions you are being cited for. You know page X got 400 impressions. You do not know whether that was one question asked 400 times or 400 different questions, whether they were commercial or informational, or whether the people asking were anywhere near buying. There is no way to triangulate that from anywhere else, and it means the report cannot tell you what to write next. Google says it is "continuing to work with website owners" on additional metrics. Until prompts arrive, this is a rear-view mirror.
Two reports, not one
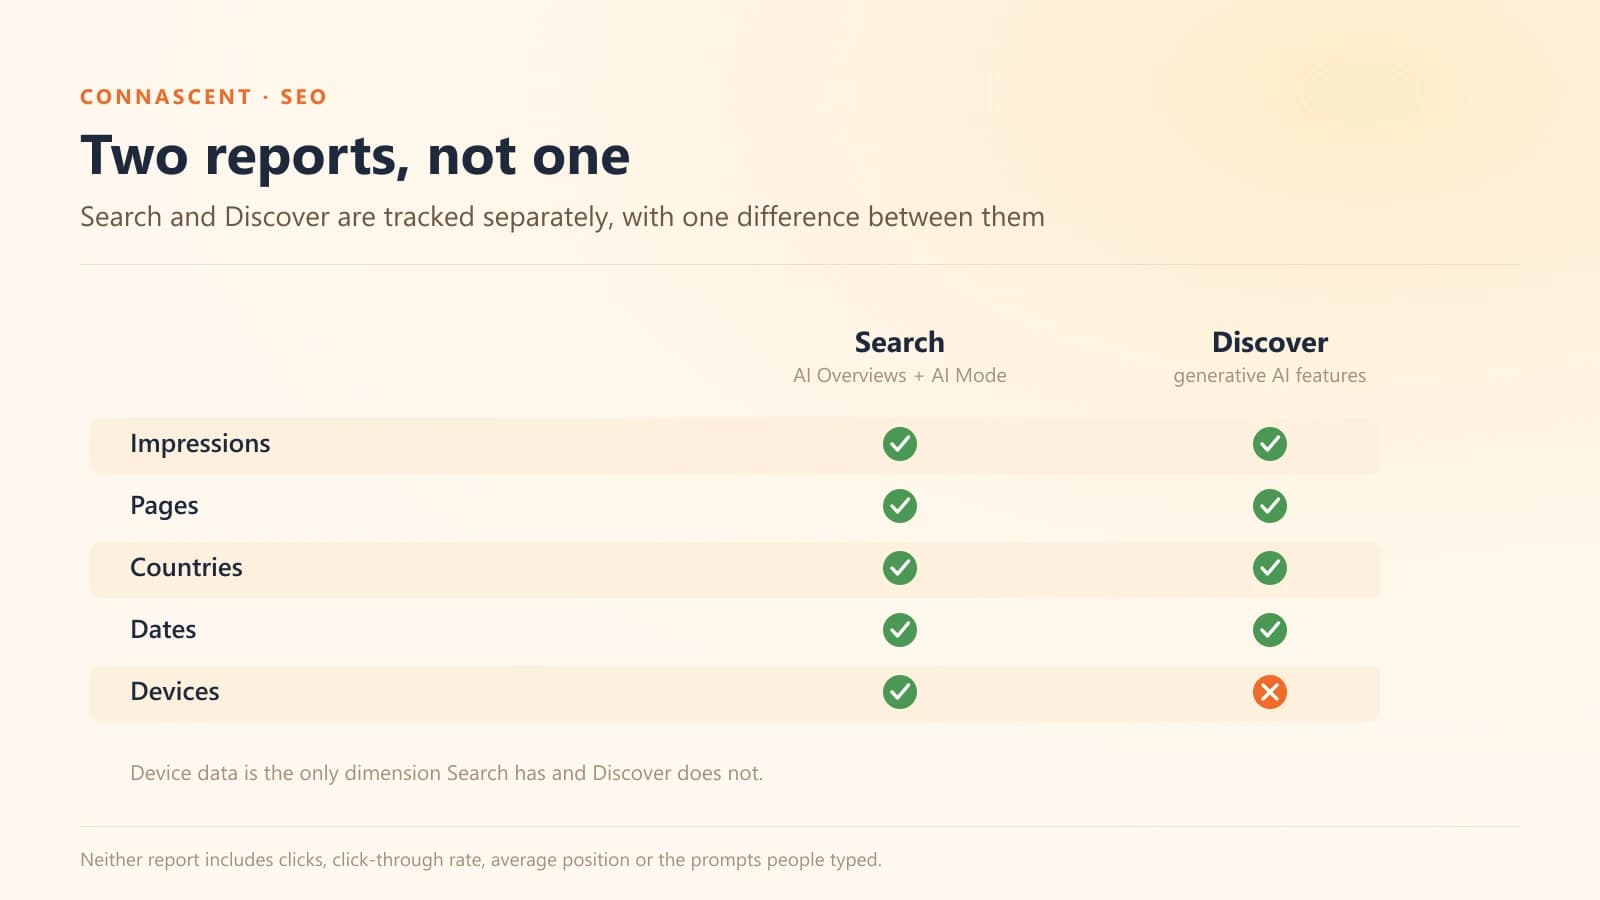
Search and Discover are tracked separately, and you will find two Generative AI entries in the sidebar if your property qualifies for both. They offer the same dimensions with a single difference: device data exists for Search and not for Discover.
Check both. Discover generative AI visibility is the one almost nobody is looking at yet, which is exactly why it is worth a look.
Why your chart starts on 18 May
There is no history, for anyone
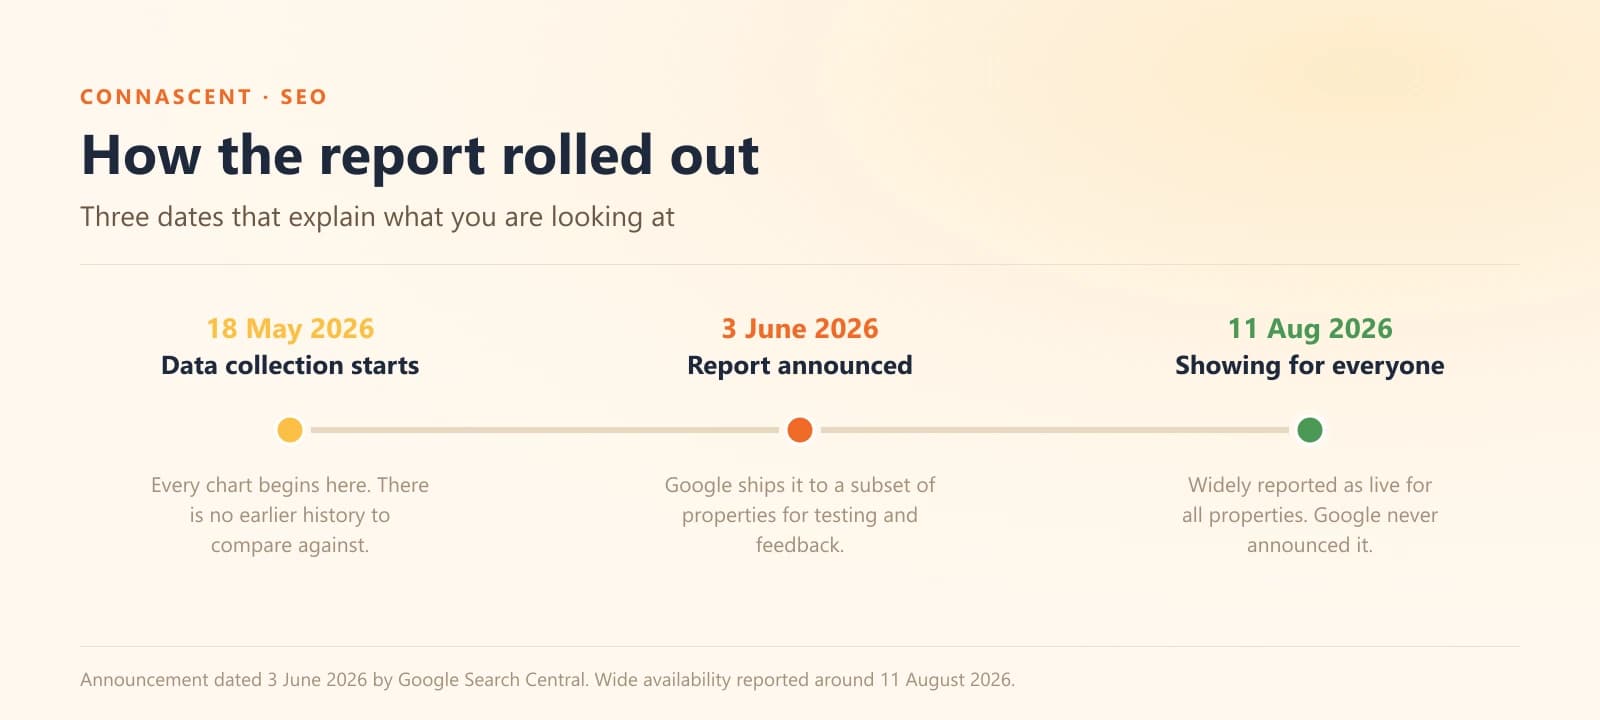
Data collection began on 18 May 2026. Whatever date range you pick, the line starts there, because Google did not backfill.
What that means for reporting
Two things, and both are worth saying out loud to whoever asks you for a comparison.
Nobody has year-over-year AI Overviews data until May 2027. If an agency shows you a chart of your AI visibility "over the past year," they built it from a third-party rank tracker's estimates, not from Google's data. Those tools guess at AI Overview presence by running queries and looking at results. That is a legitimate method with a real error rate, and it is not the same thing as Google telling you what happened.
The second thing is quieter. Because everyone's baseline starts on the same day, the first genuinely useful comparison you can make is against yourself in three months. Set a reminder rather than a target.
How to find it
Where it lives
Open Search Console. Expand Performance in the left sidebar. Under Search results you will find Generative AI, and if your property gets Discover data, Discover has its own Generative AI entry underneath. Both carry a Beta label.
If it is not there yet
Google announced it on 3 June for "a subset of websites," and it was widely reported as live for all properties around 11 August 2026. Google never formally announced the completed rollout, which is worth knowing before you go looking for a press release that does not exist.
If you cannot see it, the likely reasons are that your site has too few impressions in AI features to clear Google's reporting threshold, or that you have opted out of generative AI features. There is no queue to join and nothing to request.
The mistake almost everyone will make
Your AI impressions were already in your totals
I said it above and I will say it again because I expect to see this in slide decks within a month: these impressions are not additional.
If your site had 40,000 Search impressions last month and the Generative AI report shows 6,000, you did not have 46,000. You had 40,000, of which 6,000 came from AI features. Anyone presenting that 6,000 as newly discovered visibility is inflating the number, whether they know it or not.
The caveats Google buries in the docs
Three, and they all affect how much you should trust a given figure.
The newest data is preliminary. Google says it "is still being collected and might change in the next few hours," so do not screenshot today's number and treat it as final.
The standard limits apply, including the 1,000-row cap. On a large site your Pages tab is a top-1,000 list, not a complete inventory.
Chart totals and table totals can disagree, because they are aggregated differently. That is documented behaviour, not a bug, and it will not reconcile no matter how long you stare at it.
What this report is actually good for
Here is where I stop criticising it, because there is one job it does genuinely well.
Finding the pages Google's AI already trusts
Open the Pages tab, sort by impressions, and read the top ten URLs.
That list is the most direct answer you have ever had to the question "what does Google's AI consider citation-worthy on my site?" Not a theory about what AI search engines like. Not a checklist from a tool vendor. Ten actual URLs from your actual domain that actually got cited.
Look at what they have in common. Length, structure, whether they answer a question directly in the opening paragraph, whether they carry original data or just restate what everybody else says. Then write more of that. This is the single highest-value thing in the report and it takes about fifteen minutes.
Watching direction, not magnitude
The absolute number tells you very little. The direction tells you something.
A steady climb means more of your pages are clearing the bar for citation. A flat line on a site publishing regularly means your new content is not clearing it. Both are useful, and neither requires the click data to interpret.
Catching a collapse early
If AI impressions fall off a cliff and stay down for a fortnight, something changed: a technical problem, a Google update, or a page that stopped being the best answer. You will see it here before it shows up in a monthly traffic report, and knowing about it two weeks early is worth something.
What I would not do with it
Three things, stated plainly.
Do not make it a KPI. Impressions with no clicks attached measure exposure, not outcome, and AI Overviews exist specifically to answer the question so the user does not have to click. A rising line is ambiguous by design: it might mean more people are finding you, or it might mean Google is answering more of your questions on your behalf. A metric that cannot distinguish between those two is not a metric you can be held to.
Do not put it in a client report as a win. If you show a client "AI Overviews impressions: up 40%" with no clicks beside it, you are teaching them to value a number that has no demonstrated link to their revenue. When that number eventually falls, you will have to explain why it never mattered, which is a much worse conversation than not raising it.
Do not optimise for it directly. There is no query data, so there is nothing specific to optimise toward. Anyone selling you "AI Overview optimisation" priced against this report is selling against a number they cannot attribute. The work that gets you cited is the same work that has always got you cited: answer real questions clearly, on pages that load and can be crawled. Our guide to appearing in ChatGPT and AI Overviews covers the actual mechanics.
The verdict
It is a genuinely useful diagnostic and a bad performance metric, and the trouble is that it is shaped like a performance metric. It has a big number, a line chart, and a place in the Performance section of Search Console. Everything about its presentation invites you to treat it as a scoreboard, which is precisely what it cannot be until clicks arrive.
Google deserves credit for shipping it. Before June, AI Overviews visibility was a black box that only third-party tools would guess at, and now it is Google's own data. That is a real improvement.
But an impressions-only report answers "were we shown?" and leaves "did it do anything?" completely open. Given that the entire commercial anxiety about AI search is whether it takes your traffic away, leaving that question unanswered is a strange place to stop.
What to do this week
Open the report and check both Search and Discover. Sort Pages by impressions and write down your top ten URLs. Work out what those pages have in common and brief your next three articles against it.
Then close the report and go back to measuring organic sessions and revenue, which are still the numbers that tell you whether any of it worked.
If you want help reading yours, or turning that top-ten list into a content plan that earns more citations, talk to our team or start with a free estimate. We do this inside our SEO and SEO analytics work, and it pairs directly with the platform properties Search Console added earlier this year.